q 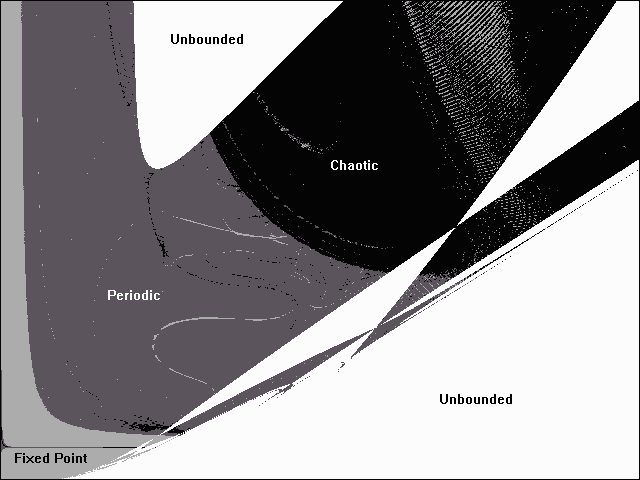
c
Fusion plasmas magnetically confined by tokamak devices often exhibit relaxation oscillations in hydrogen-alpha (or deuterium-alpha) emission and other quantities in the outer edge of the plasma when in the high-confinement mode (H-mode) at sufficiently high plasma pressure (beta). These oscillations are called edge localized modes (ELMs). Although the ELMs degrade the confinement, they are potentially beneficial for removing helium ash from a fusion plasma. The ELMs are approximately periodic, but the period and amplitude generally exhibit variations which are presumably chaotic. Many theoretical models for the H-mode and ELMs have been proposed. A particularly simple model was recently advanced by H. Sugama and W. Horton in Plasma Phys. Control. Fusion 37, 345-362 (1995). This note shows that their model leads to chaotic dynamics with some choices of parameters, and it characterizes the chaos thus produced.
The Sugama-Horton model describes the temporal evolution of three variables, the potential energy u associated with the pressure profile, the turbulent kinetic energy k, and the kinetic energy f associated with the background shear flow. In normalized form, these variables evolve according to the equations:
du/dt = q - u1/2k
dk/dt = u1/2k - cu-1/2fk - d-1(u)k2
df/dt = cu-1/2fk - cm(u)f
where q is the normalized potential energy input, which is a controllable parameter, and c is a nondimensional numerical constant. The function d(u) is the L-mode anomalous diffusivity, which depends on u through its dependence on background temperature. The function m(u) is related to the ion collisional viscosity. Following Sugama and Horton, we take d(u) = u and m(u) = u-3/2(0.95 + 0.05u5/2).
Sugama and Horton found limit-cycle solutions for q = 1.8 and c = 5.0 but did not observe chaos. Here we explore the dynamical behavior of the above system over the whole space of 0 < q < 15 and 0 < c < 20. The equations were solved using a fourth-order Runge-Kutta integrator for 32000 steps with a step size of 0.02 and initial conditions of u(0) = k(0) = f(0) = 0.05. The character of the solution was identified by calculating the largest Lyapunov exponent. Exponents greater than 0.008 were assumed to be chaotic, exponents less than -0.005 were assumed to be fixed points, and other exponents were assumed to be limit cycles (although they could also be toruses). A solution was assumed to be unbounded if |u| ever exceeds 5000. The calculation was implemented in PowerBASIC using the source and (DOS) object code provided. The resulting plot is shown below:
q
c
It is likely that some of the unbounded solutions above are a result of initial conditions outside the basin of attraction. It would be even more computationally intensive to test for this possibility.
With a slight modification of the code, the Lyapunov exponent in the chaotic region can be displayed as a gray scale on the same axes as above. The source and object code for accomplishing this are provided. The gray scale is linear in the range of Lyapunov exponents from 0 to 0.2 in the plot shown below:
q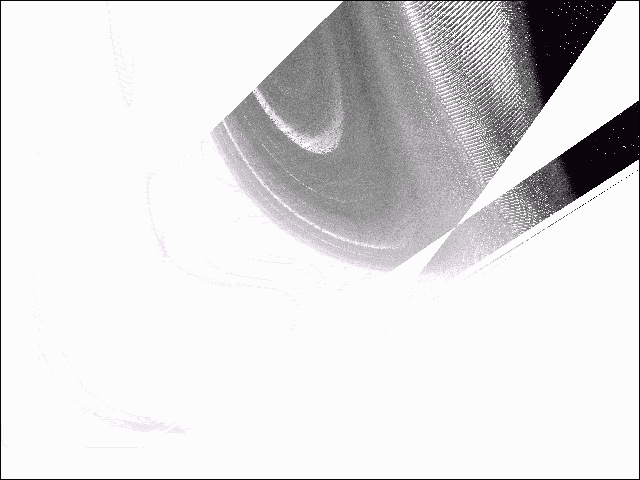
c
The smallest parameter values that put the dynamics comfortably into the chaotic region are q = 9 and c = 9. The remainder of this note will concentrate on that case. The time evolution of the three variables were calculated over 32000 time steps starting from a point on the attractor with a step size of 0.002 using the source and object code provided, and the chaotic results are shown below:
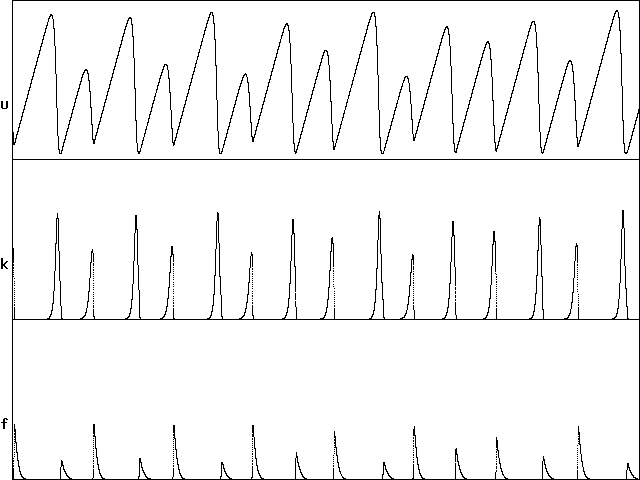
time
In a much longer run, the Lyapunov exponents (base-e) converge to about (0.085, 0, -0.938), giving a Kaplan-York dimension of about 2.090. An animated view of the attractor is shown below:

In the image above, the k axis points upward, and the object rotates in the u-f plane.